- About

Getting to know us
- Industries
Recent case study:
Oracle EBS Cloud Deployment
Consolidating and Migrating assets into Oracle Cloud Infrastructure.
.png?width=250&name=stonewater-logo%20(1).png)
Most Visited Pages
-
- Resources
DSP-Explorer acquires leading Oracle Applications Managed Services Provider, Claremont, to further extend its data management capabilities.

Resources
- Contact us
The Premier League meets Power Bi: Part 2
Contents
What makes the Premier League?
Analysis of the 2018/19 Premier League Season using Power Bi
(In case you missed the first installment, you can find parts 1 and 2 here.)
Part III: Can we predict the League table accurately?
Quick answer: no. The problem here is that there isn’t enough data to make a statistically significant model, so while we could see clear relationships between the variables above, we can’t use these relationships to accurately predict the table. A model based on more seasons would be more reliable, but it is difficult to obtain such data as the Premier League protects their data rights on behalf of their official statistics partner, Opta.
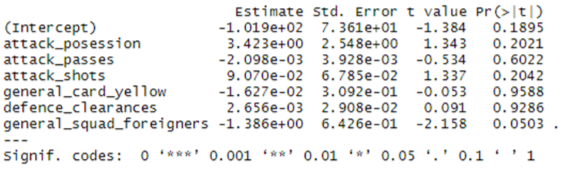
The linear model we have made with this single season data suggests that every pass costs a team 0.002 points and every shot gains them 0.09 points. It is important to not confuse this correlation for causation - if a team started shooting from the half-way line, they would have more shots but would be unlikely to gain 0.09 points for every one of these shots. This demonstrates the importance of understanding the statistical context of models being produced.
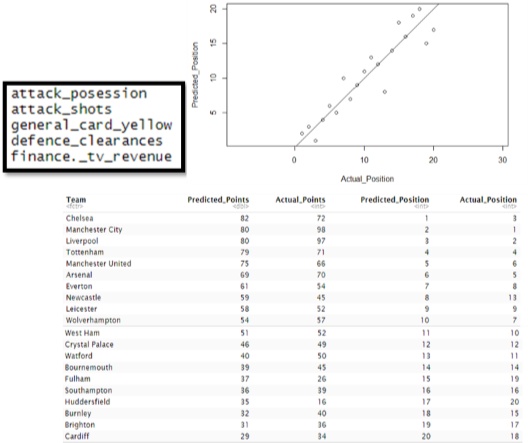
Selecting too many variables can also have a detrimental impact on the accuracy of the model when there is so little data. For example, using the variables listed on the right leads to a prediction where Cardiff win the league with more points than can be attained in a Premier League season. Cardiff had impressive passing statistics for a team so far down the table, which causes issues if a model is too heavily dependent on passing.
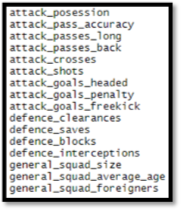
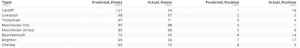
With some more thought in the variable selection I reached a much more accurate model. This model managed to get the league position of 5 of the teams correct, and 18 of the 20 teams were placed within 3 positions of their actual league position. This model works better with the smaller dataset as the information in these variables is quite broad, covering a wide range of information without overfitting as the previous model did. However, this model could not predict the unprecedented battle at the top of the table, as Manchester City and Liverpool achieved the second and third best points totals ever seen in the league.
With more data available it is likely that a Neural Network model would be useful to create a prediction of the Premier League, as this method is useful for finding underlying interactions between variables which are not obvious to a human looking at the data. The results of this model would be harder to interpret, and we wouldn’t get the ‘every shot is worth 0.09 points’ type result as seen in the linear model above.
What we have seen from this analysis is that it’s not easy to predict football – but I can only imagine that’s a good thing. The (relative) unpredictability of the Premier League has helped it to become the most watched league in the world, with a potential TV audience of 4.7 billion people, well over half of the world population.
If fans believed they knew who would win, who would bother to watch? The sport would fall apart. That said, the final linear model got fairly close: with more data we could likely predict most of the league table correctly, missing only the truly exceptional cases.